Researchers release solar power data software to increase clean energy generation
The software tool sorts through messy data to reveal what’s really going on with solar panels on cloudy and sunny days.
By David Krause
A lot can happen to solar panels that are mounted to a roof – from tree branches casting shade over them to a neighbor’s baseball cracking one.
Now, a solar panel owner can better understand how their system is performing with a new software tool that transforms solar energy data into a clear picture of power generation over time. The tool could make it easier for solar owners to maintain their systems as the years go by, helping them generate more clean electricity for their homes and an electric grid.
The software, called Solar Data Tools, reveals a system’s performance on cloudy days versus sunny days; potential shade impediments, like buildings or vegetation; or more catastrophic changes, like hail pellets damaging panels during a storm. Built by a team of researchers with SLAC National Accelerator Laboratory’s Grid Integration Systems and Mobility lab (GISMo) lab, the software is also open source, meaning anyone interested can access it.
“A person with rooftop solar panels might wonder if their panels are generating as much power as when they were first installed,” said SLAC scientist Bennet Meyers, who works on the GISMo team and led the development of the software. “Since many people do not have backgrounds in data science or electrical engineering, our software gives them more direct insight into their systems.”
A growing demand
The demand for rooftop solar systems is growing – installations increased 34% in the U.S. from 2020 to 2021 – and with it the need for more user-friendly software like Solar Data Tools.
Something similar already exists for large solar energy systems, such as the utility-scale solar arrays in California’s deserts. But these larger systems often have teams of engineers that interpret data and then develop power generation solutions. Engineers do this with reliable weather data and knowledge of PV system modeling – things that are not available to many everyday solar power system owners or disadvantaged communities with solar energy systems.
If smaller, home solar power systems were better maintained, they could generate more clean electricity – and do so more reliably, since their power generation will be more consistent. More reliable energy resources are a high priority for electric grid operators around the world as more intermittent resources, like solar and wind energy, connect to the grid.
Turning incoherent noise into music
To build their software, the researchers collected data from about 1,000 solar panel sites at five minute intervals over three to ten years. This data helped researchers land on a set of algorithm design principles, such as needing minimal data input and minimal engineering work, and including error estimates.
More specifically, the researchers relied on a technique called signal decomposition to build the software. Signal decomposition takes only the data received by a solar panel system logging machine – only how much power is being generated, so no data from weather stations – and breaks down this data to tell a story about a system’s power generation. This is like sorting through noise coming from a room that you cannot see – a room with kids running, music playing and dogs barking. Signal decomposition separates the different noises in the room so that you can hear one sound at a time, so you can hear the music in the noise.
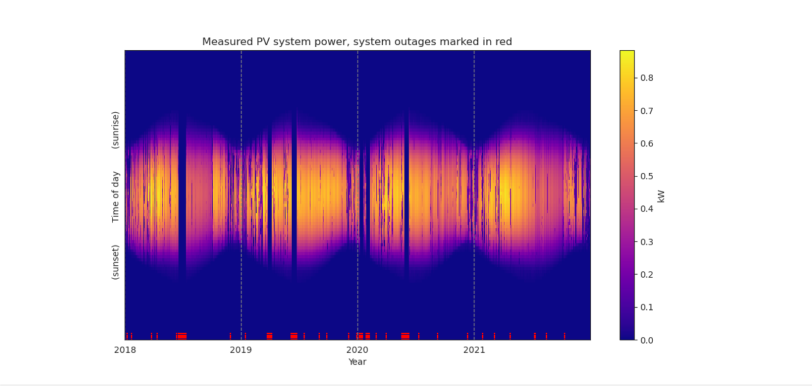
“PV data can look incomprehensible at first,” said SLAC engineer Sara Miskovich, who is part of GISMo and a developer on the project. “But after running the data through signal decomposition, you can see things like the days when clouds were blocking the sun, or when there was a total loss of power due to something maybe falling on a panel.”
Importantly, the software is safe, interpretable and auditable thanks to the way the team decided to code the algorithms, Meyers said. Instead of using more popular artificial intelligence and neural network coding techniques, which can make a software more difficult to understand step-by-step, the team coded in a computer language that is easy to follow. Software that is safe, interpretable and auditable is particularly critical in the energy industry, which provides essential resources to communities on a daily basis, Meyers said.
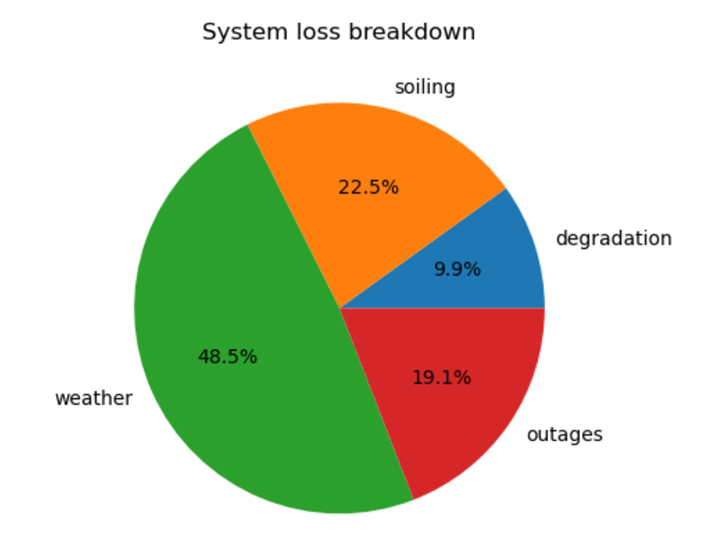
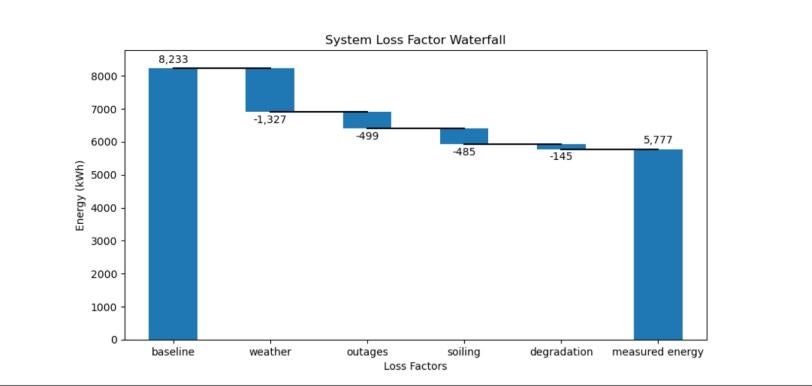
Currently, the team’s software will help people with home solar systems and energy organizations download easy-to-understand graphs of their power generated over time. These graphs reveal the moments when system failure occurred or when power dipped for some unknown reason – the critical first piece of knowledge that is always needed in order to fix a system issue.
Going forward, researchers want to make the tool even more user-friendly so that more people at home can understand their solar data on a phone application. Right now, technically-inclined users can interact directly with these algorithms, so researchers are working on how to allow less technical users to access the tools on an app and a point and click interface, Meyers said.
“We can learn so much from solar energy data,” Meyers said. “The more people that can understand their data, the better.”
This material is based upon work supported by the U.S. Department of Energy's Office of Energy Efficiency and Renewable Energy (EERE) under the Solar Energy Technologies Office (SETO).
For questions or comments, contact the SLAC Office of Communications at communications@slac.stanford.edu.
About SLAC
SLAC National Accelerator Laboratory explores how the universe works at the biggest, smallest and fastest scales and invents powerful tools used by researchers around the globe. As world leaders in ultrafast science and bold explorers of the physics of the universe, we forge new ground in understanding our origins and building a healthier and more sustainable future. Our discovery and innovation help develop new materials and chemical processes and open unprecedented views of the cosmos and life’s most delicate machinery. Building on more than 60 years of visionary research, we help shape the future by advancing areas such as quantum technology, scientific computing and the development of next-generation accelerators.
SLAC is operated by Stanford University for the U.S. Department of Energy’s Office of Science. The Office of Science is the single largest supporter of basic research in the physical sciences in the United States and is working to address some of the most pressing challenges of our time.